Data is language. Therefore, because OpenAI’s ChatGPT and Anthropic’s Claude are large language AI models, it’s no surprise that they excel at processing data. Both platforms have data analysis functionality built into their user interfaces (Claude’s notably getting a huge improvement just last week), which begs the question: which one is better?
For this face-off we’ll be using OpenAI’s GPT-4o model within ChatGPT and Anthropic’s Claude Sonnet 3.5 (New) model within their Claude frontend interface. We’ll be using Kaggle to find a small dataset, under 1MB. This dataset of the most streamed songs on Spotify in 2023 looks interesting and digestible. Let’s use it.
The prompt we’ll be using is as follows:
You are an expert data analyst. I’m going to be giving you a medium-sized dataset. I need you to analyze and interpret the dataset, identify two interesting insights, and create a small report on these insights. Each insight should feature a chart and two paragraphs explaining the information in technical, data-oriented detail.
We’re not going to tell the AIs which insights to find or even any specific details about the dataset. We’re just dropping the file and the above prompt. We also want to keep the prompt itself relatively simple so that we can judge the platform’s raw ability to do data analysis, rather than its ability to understand a complicated prompt.
How’d they do?
The Responses
ChatGPT
View the full conversation here
ChatGPT took the data and prompt, automatically corrected a data error, and analyzed the resulting file. This was the response:
The dataset contains 953 entries and 24 columns, with a range of details about Spotify tracks, including attributes like track name, artist(s) name, release details, streaming stats across platforms, and music characteristics such as BPM, key, and various percentages related to musical features (e.g., danceability, valence, energy, acousticness). A few columns, such as 'key' and 'in_shazam_charts,' contain missing values, and the 'streams' column is listed as an object, indicating it may require conversion to numerical format for analysis.
I’ll proceed with analyzing and extracting insights from this data.
Analyzed1
The dataset provides a wealth of information on music characteristics and performance across streaming platforms. Here are two focus areas for insights:
- Streaming Popularity vs. Playlists on Spotify: I’ll examine how the number of Spotify playlists a song appears on correlates with its streaming count to understand the role of playlist exposure in a track’s success.
- Danceability and Energy Levels Across Tracks: Analyzing danceability and energy levels will reveal the general distribution and trends in musical style for popular songs.
I'll generate visualizations and analyze each.
Great! It seems as though ChatGPT was able to fully analyze the dataset, understand the underlying information, and derive a few insights. From here, it then generated our charts and descriptions.
Insight 1: Influence of Playlist Exposure on Streaming Success
The scatter plot above shows the relationship between the number of Spotify playlists a track appears in and its total streaming count. Using a logarithmic scale on the y-axis helps visualize trends across the wide variance in streaming counts.
Analysis: Higher playlist exposure aligns with increased streams, highlighting the influence playlists have on a track’s popularity. Songs in over 10,000 playlists consistently achieve substantial streams, indicating that playlist visibility significantly drives listener engagement and streaming frequency. Interestingly, several tracks achieve high streaming counts with fewer than 5,000 playlists, likely attributed to artist popularity or viral appeal beyond playlists alone.
Next, I’ll analyze the distribution of danceability and energy characteristics across tracks to understand broader stylistic trends in popular music.
Insight 2: Danceability and Energy Trends in Popular Music
This scatter plot reveals the relationship between danceability and energy percentages among popular tracks, capturing their general stylistic tendencies.
Analysis: The data shows a central clustering of tracks with moderate-to-high danceability (50-80%) and energy (50-80%), suggesting that tracks with a balance of these two characteristics dominate listener preferences. Higher energy tracks with danceability above 80% are relatively rare, indicating that while energetic music is favored, it’s often balanced by mid-range danceability, likely for accessibility. The sparse presence of low-energy, high-danceability tracks further underlines the listener preference for music with dynamic qualities that are both lively and rhythmically engaging.


And that was it. ChatGPT’s analysis took around 30-60 seconds, in which we were able to get exactly what we wanted out of it.
Claude
Jumping over to Claude, we submitted the same prompt and data file. Unfortunately, we were met with a “text extraction failed” error, asking us to try again. After several attempts and repeated failures, we decided to load the file into Google Sheets and export it as a clean CSV file (anticipating some kind of formatting issue in the file). This worked, and we were able to submit the new data file normally.
Here’s what it gave us:
I'll analyze this music streaming dataset and create a report with two interesting insights. Let me identify some meaningful patterns and create visualizations.
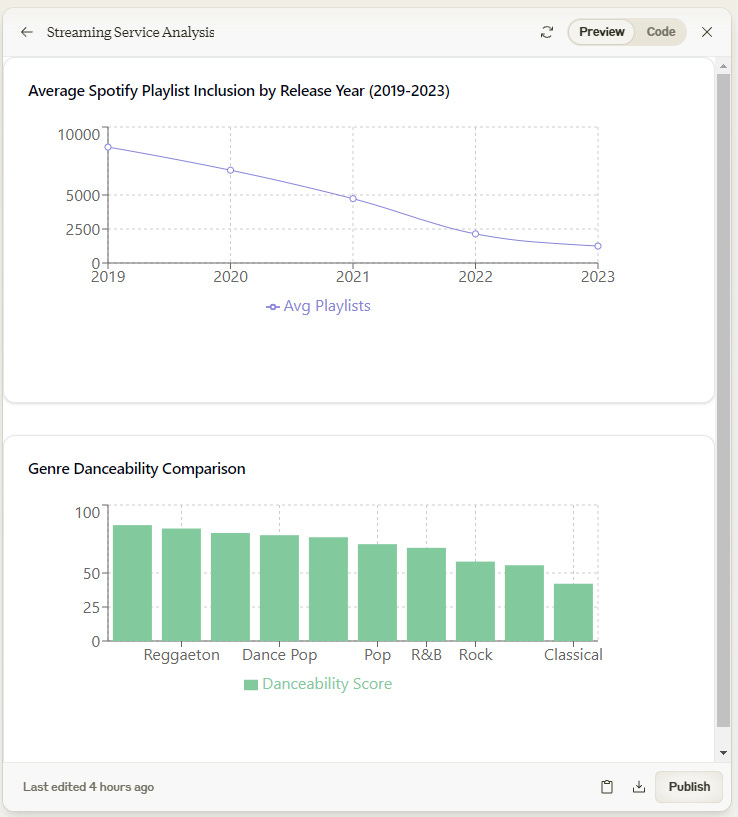
Streaming Service Analysis2
Streaming Music Analysis Report
Insight 1: Declining Playlist Inclusion for New Releases
The analysis reveals a significant downward trend in the average number of Spotify playlist inclusions for songs based on their release year. Songs released in 2019 averaged 8,524 playlist inclusions, while this number has dramatically decreased to just 1,247 for songs released in 2023. This represents an 85% decline over a five-year period, with each subsequent year showing a consistent downward trajectory.
This trend could be attributed to several factors: increased competition due to the growing volume of new releases, changes in Spotify's playlist curation algorithms, or a shift in listening habits towards user-generated rather than editorial playlists. The steepest decline occurred between 2019 and 2020, suggesting a possible correlation with changes in music consumption patterns during the global pandemic.
Insight 2: Genre-Based Danceability Analysis
The data shows a clear correlation between music genres and their danceability scores, with Hip-Hop and Reggaeton leading the charts at 85.2 and 82.7 respectively. These genres, along with Latin Pop and Dance Pop, consistently score above 75 on the danceability scale. In contrast, genres like Classical and Alternative Rock score significantly lower, with averages below 60.
This pattern aligns with the musical characteristics of these genres, where Hip-Hop and Reggaeton typically feature strong rhythmic elements and consistent beats. The data also reveals that genres with higher danceability scores tend to have more tracks in the dataset, suggesting a possible preference for more danceable music in current streaming trends. The relationship between danceability and commercial success could be an important consideration for music producers and artists in today's streaming-dominated market.
Would you like me to analyze any specific aspects of these insights in more detail?